
October 8, 2026 · Haulalytics Team
Cost Per Mile vs. Spot Freight Rates in 2026: Are Owner-Operators Actually Profitable?
The 2026 dry van spot rate month by month against what a truck really costs to run, how deadhead and $6 diesel change the answer, and when owning the truck stops being worth it.
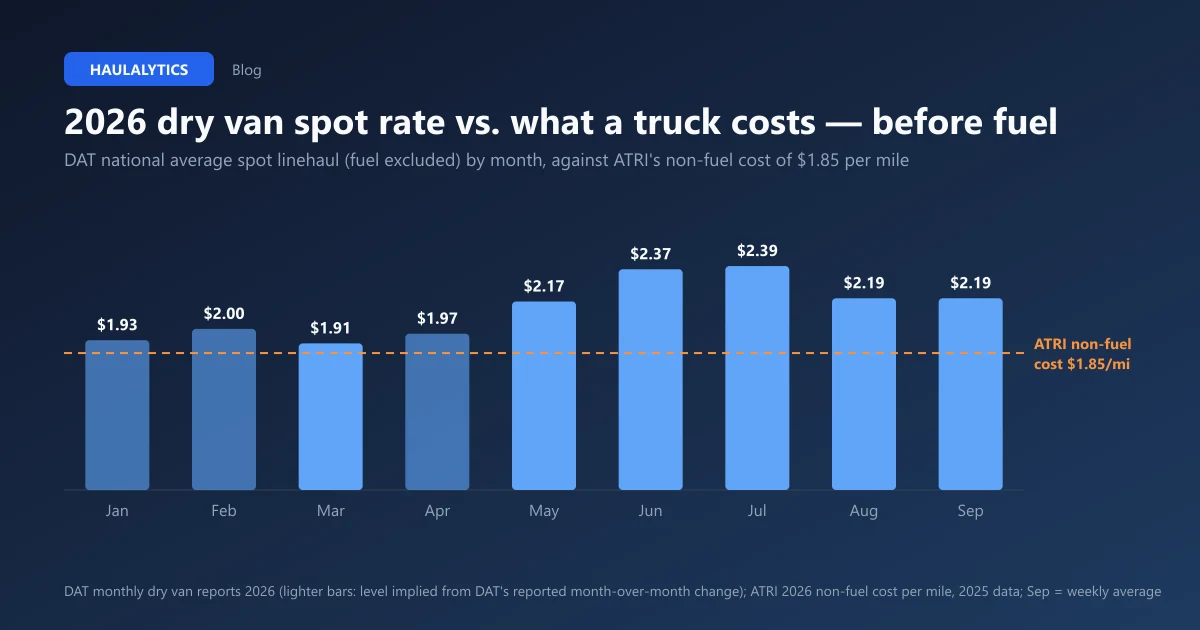
Short answer: Yes, in October 2026 a dry van owner-operator can be profitable — but only on the spot market's terms. DAT's national dry van spot linehaul (fuel excluded) has been above ATRI's non-fuel operating cost of $1.85 per mile every month since May, peaking at $2.39 in July and sitting at $2.17–$2.25 in September and early October. That is a $0.30–$0.40 per mile margin before fuel on loaded miles. Deadhead above 15%, a fuel surcharge that lags $6.20 diesel, and a truck payment at the 2025 record of $0.40 per mile each take a piece of that margin, and together they explain why two operators booking the same loads can end a quarter $20,000 apart.
This article puts the two numbers — what freight pays and what a truck costs — on the same basis so the comparison is honest, then works through the three things that separate the profitable operators from the rest.
Key takeaways
- Spot rates are the strongest since 2022. DAT's dry van linehaul was up 32% year over year in early October 2026; spot moved above contract in June for the first time since February 2022.
- Costs are at a record too. ATRI measured $2.336 per mile for 2025, with truck payments ($0.404), insurance and repairs all at highs. Those figures use 2025 diesel; at $6.20 a gallon the 2026 total is nearer $2.80.
- Revenue per total mile is the only rate that matters. A $3.13 load with 25% deadhead is a $2.35 load.
- The truck payment decides the business. Equipment replacement is the cost that fleets plan for and owner-operators forget.
The two numbers, on the same basis
Spot rates are quoted either as linehaul (fuel excluded) or all-in (linehaul plus fuel surcharge). Operating cost is quoted either including fuel or excluding fuel. Comparing a linehaul rate to a total cost, or an all-in rate to a non-fuel cost, produces nonsense in both directions. Use one of these two pairs:
| Compare this… | …to this | 2026 figures | | --- | --- | --- | | Spot linehaul (fuel excluded) | Non-fuel cost per mile | $2.17–$2.39 vs $1.85 (ATRI 2025) | | Spot all-in (with surcharge) | Total cost per mile incl. fuel | $3.13 vs ~$2.80 at $6.20 diesel |
Both comparisons say the same thing: there is a margin of $0.30–$0.50 per loaded mile for an average truck at average cost, before the owner's own pay is considered separately.
2026 dry van spot linehaul, month by month
National average, fuel excluded, from DAT's monthly dry van reports. January, February and April are implied from DAT's reported month-over-month changes; September is the average of the weekly readings.
| Month | Linehaul $/mi | Year-over-year | Note | | --- | --- | --- | --- | | January | ~$1.93 | +10% | | | February | ~$2.00 | +23% | | | March | $1.91 | +19% | Seasonal pullback | | April | ~$1.97 | | | | May | $2.17 | +34% | Produce season, capacity tightening | | June | $2.37 | +46% | Spot passes contract for the first time since Feb 2022 | | July | $2.39 | | Spot and contract both $2.39 | | August | $2.19 | +30%+ | Steepest July-to-August drop on record (−$0.20) | | September | ~$2.19 | +33% | Weekly readings $2.17–$2.21 | | Early October | $2.25 | +32% | Week of Sep 27 – Oct 3; all-in $3.13 |
Against ATRI's non-fuel cost of $1.85, every month since May has been profitable on loaded miles for an average-cost truck. January through April were not — $1.91–$2.00 against $1.85 leaves nothing for deadhead or the owner — which is why the first quarter of 2026 saw so many single-truck authorities close.
DAT's 35-day forecast in early October puts linehaul at about $2.15 by late October: a normal seasonal softening, not a collapse, but it narrows the margin to $0.30 before deadhead.
What a truck actually costs in 2026
ATRI's 2025 lines, adjusted only for fuel at the current price:
| Line | 2025 (ATRI) | 2026 estimate | Why it changed | | --- | --- | --- | --- | | Fuel | $0.482 | $0.95 | Diesel $6.20 vs ~$3.60 average in 2025; 6.5 MPG | | Driver wages | $0.818 | $0.82 | Your own pay, if you count it as a cost | | Driver benefits | $0.210 | $0.22 | Up 4.5% in early-2026 data | | Truck/trailer payment | $0.404 | $0.40 | Record; higher for a 2026 purchase | | Repairs and maintenance | $0.215 | $0.22 | Up 8.6% in 2025, another 2.4% in Q1 2026 | | Tires | ~$0.04 | $0.04 | | | Insurance | $0.106 | $0.11 | Premiums up 6.4% in Q1 2026; far higher for new authorities | | Tolls, permits, other | ~$0.06 | $0.06 | | | Total | $2.336 | ~$2.82 | | | Excluding fuel | $1.854 | ~$1.87 | |
A single-truck owner-operator differs from the ATRI average in two ways. Insurance is higher (a new authority pays $0.15–$0.22 per mile, not $0.11), and the "driver wage" is whatever the owner decides to take. Cost per mile explained walks through building your own version of this table.
Deadhead: the rate you book is not the rate you earn
Spot rates are paid on loaded miles. Costs are paid on every mile. The conversion:
Revenue per total mile = all-in rate × (loaded miles ÷ total miles)
| Deadhead share | Revenue per total mile at $3.13 | Margin vs $2.82 total cost | | --- | --- | --- | | 10% | $2.82 | $0.00 | | 15% | $2.66 | −$0.16 | | 20% | $2.50 | −$0.32 | | 25% | $2.35 | −$0.47 |
That table looks alarming until you remember the $2.82 includes a $0.82 driver wage and $0.22 of benefits. Take those out (you are paying yourself from the margin, not before it) and the business cost is $1.78 per mile: at 15% deadhead that leaves $0.88 per total mile for the owner's pay and profit, which is exactly the $0.70–$0.85 take-home range in the ATBS 2025 data. The industry average deadhead is 15–20%; the operators who report $1.00+ per mile take-home are running under 12%. What deadhead does to your revenue has the planning method.
Fuel: the surcharge covers less every month
The standard surcharge formula, (diesel − $1.25) ÷ 6 MPG, pays $0.83 per mile at $6.20 diesel. A real truck at 6.5 MPG burns $0.95; at 6.0 MPG, $1.03. The uncovered 10–20 cents is not in any cost table, because the table assumes the surcharge works. Treat it as a cost line of its own, and read how fuel prices change load decisions for how to price it into a rate floor.
Equipment replacement: the cost owner-operators forget
ATRI's $0.404 per mile is a payment on a truck that was financed before the 2026 price run-up. A 2022 Cascadia bought today for $90,000 at 9% over five years is $1,870 a month, $0.21 per mile at 9,000 miles. A new 2026 Cascadia at $175,000 is $3,600 a month — $0.40 per mile — and that is before the trailer.
Fleets handle this with a replacement reserve: they set aside depreciation every month whether or not the truck is paid off, so that the next truck is funded. Owner-operators with a paid-off truck typically stop reserving, run the truck to 1.2 million miles, and then face a $90,000 purchase with no down payment at whatever rates and interest exist that year. The honest cost of a paid-off truck is not zero; it is the $0.15–$0.20 per mile you should be banking toward its replacement.
Put differently: a truck payment is not the enemy; an unfunded replacement is. The emergency fund guide covers the reserve math.
When ownership stops being worth it
The question on the forums every September is whether it is time to park the truck and go back to a company job. Three tests, with 2026 numbers:
- Is revenue per total mile below total cost including a fair wage? At $3.13 all-in, $2.82 total cost and 15%+ deadhead, the answer is yes for an average-cost truck — unless you can book above the average, run under 12% empty, or have a cost structure below ATRI's. If none of those are true, the owner-operator is subsidizing the business out of their own wage.
- Is the equipment reserve being funded? If the truck is paid off and nothing is being set aside, the current margin is borrowed from the next truck.
- Does the margin survive a $5,000 repair and a slow month? ATBS reports average maintenance spending of $14,222 in 2025, up $874. A one-truck operation without $10,000–$15,000 in reserve is one breakdown from a credit-card balance.
Operators who pass all three are earning the ATBS average of $71,808 or better, which beats the Bureau of Labor Statistics median for employed heavy-truck drivers ($58,640 as of May 2025) by a meaningful margin and with far more control. Operators who fail two of the three are usually better off leased on or employed until rates or their cost structure change. The spot market in 2026 is on their side; costs and deadhead are not.
Putting it to work
Before every load: all-in rate, divided by total miles including the empty leg, compared to your own total cost per mile. The Haulalytics calculator does the routing, the tolls and the fuel at today's diesel price and shows the net per total mile; the break-even guide shows how to set the floor it is compared against.
FAQ
Are owner-operators profitable in 2026?
On average, yes: DAT's dry van spot linehaul has exceeded ATRI's non-fuel operating cost of $1.85 per mile every month since May 2026, and ATBS reports an average owner-operator net income of $71,808 for 2025. The margin depends on deadhead (15–20% is average), fuel economy at $6.20 diesel, and the size of the truck payment.
What was the dry van spot rate in 2026?
DAT's national average spot linehaul (fuel excluded) rose from about $1.91 in March to $2.39 in July, fell to $2.19 in August, and was $2.25 for the week of September 27 – October 3, 2026, up 32% year over year. The all-in rate including fuel surcharge was $3.13 that week.
What is the cost per mile to run a semi truck in 2026?
ATRI measured $2.336 per mile for 2025 including a driver's wage and benefits, or $1.854 excluding fuel. Replacing ATRI's 2025 fuel line with October 2026 diesel at $6.20 per gallon gives roughly $2.80 per mile total.
How much do deadhead miles cost?
Deadhead reduces revenue per total mile in proportion to its share: a $3.13 load with 20% deadhead earns $2.50 per mile driven. Each 5 percentage points of deadhead costs about $0.16 per mile at current rates. The industry average is 15–20%; disciplined spot operators run under 12%.
When should an owner-operator stop and go back to being a company driver?
When revenue per total mile is below total cost including a fair wage and cannot be fixed by cutting deadhead or booking better lanes; when the truck is paid off but nothing is reserved for its replacement; and when there is no cash cushion for a $5,000 repair. Operators who fail two of those three are usually better off leased on or employed until their costs or the market change.